The "Trace" Tool
|
If you have a problem with the program, it is possible that we will ask you to generate a trace.
Traces are reports of what the program was doing when you encouter the problem. Note: These instructions are for sliceO-6. If you have an older sliceOmatic (prior to version 6), please look a the bottom of this page for more informations. The first step is to open the trace interface. There's 3 way to do this: - From the "File menu", with the "Trace Ctrl" button of the "Debug" group. |

|
|
- Directly from the keyboard by typing both the "Ctrl" key and a number "1" to "9". The number you use will preset the trace level in the interface. - Trough the debugging interface by typing both the "Ctrl" and the "d" keys at the same time. You then have to activate the "New Trace" button in that interface. |

|
|
The default is for all "Modules" and the "Functions" to be selected for trace. Unless we ask otherwhise, keep these selected. When we asked for a trace we probably also specified the "Trace level" we wanted. Please make sure that this is the one currently selected. You press the "Start" button to start the trace. Traces thend to record a LOT of things! So, if you are trying to generate the trace of a crash, please do as many of the operations as possible in sliceO, prior to the one generating the crash, before activating the trace. If you are generating a trace for an operation that did not cause a crash, or just to get the state of the system, you then you will also need to press the "Stop" button to stop the trace. (A crash will of course stop the trace for you). This "raw" trace file will be recorded in you directory ("Documnents"\TomoVision\sliceOmatic_trace.dat). If this trace is small enough, you can sent it to us "as is". However if this is a big file (as most traces thend to be!) you may want to "clean" it first with the "Debugging" interface. |
Trace at startup
|
If your problem is that sliceOmatic crash when it start, then you will not
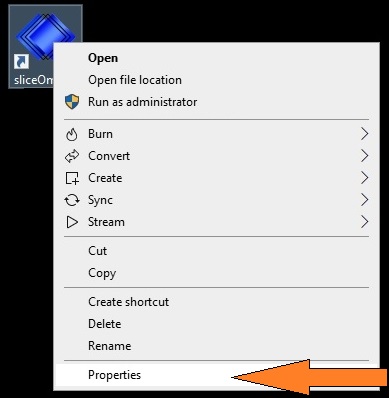
be able to access the trace interface. In that case, we need to tell sliceOmatic to start in trace mode. This is done through a mechanism called the command line arguments. You need to edit the sliceOmatic desktop icon to add these command line arguments. Right click on the "SliceOmatic" icon on your desktop. This will open a pop-up menu. From that menu select "Properties" |
|
|
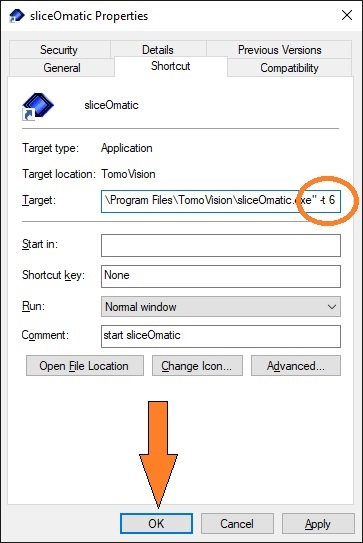
In the properties menu, you need to go to the "Shortcut" page and add "-t x" (where x is a number from 1 to 9. In the image we used 6) after the closing quotes of the "Target" line. Once this is done, you can click on the "OK" button. |
|
|
Now when you start sliceOmatic by clicking on its desktop icon, the program will start in trace mode and generate a trace in your "Documents\TomoVision" folder. |
The "Debugging" Tool
|
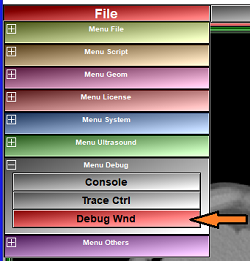
You can open the debugging interface either: - From the "File menu", with the "Debug Wnd" button of the "Debug" group. |
|
|
- Directly from the keyboard by typing both the "Ctrl" key and "d" keys at the same time. |
|
|
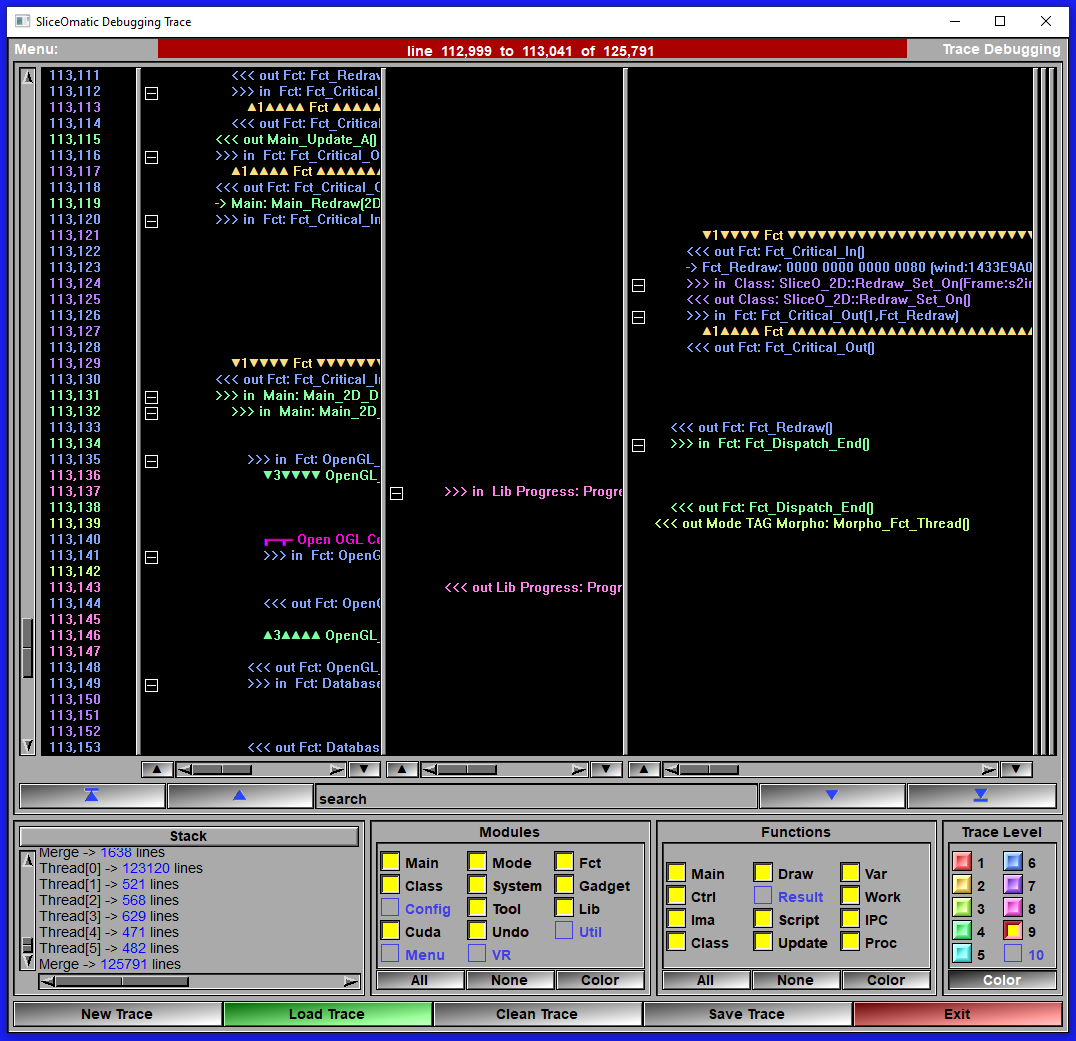
The "New trace" button open the trace interface of the previous section. Once you have generated a trace with the "Trace Interface", you can load it in the debugging tool by simply pressing the "Loat Trace" button. Thsi will load the trace file "sliceOmatic_trace.dat" found in the user's directory ("Documnents"\TomoVision\). You can then use the "Clean Trace" button to remove duplicate lines and greatly reduce the size of the trace. The next step is to press the "Save Trace" button to create a copy you can send us. That copy will be placed in your desktop. It's name will be composed of "SliceO_", your computer's name, the current date and the ".trace" extension Please email us that file. You can find more information on both the trace and debugging interface in the appendix of the sliceOmatic User's Manual. |
SliceOmatic 5.0
|
If you have an older version of sliceOmatic, then the traces are less strated
simply by pressing "Ctrl" and a number key ("1" to "5") at the same time. Traces can aslo be stopped by pressing "Ctrl" and "0" at the same time. Traces will be called "sliceO_trace.dat" and be located in your scratch directory (by default "C:\Temp\"). |