In this module, you compute Radiomics values for the tagged region of interest in all selected 3D groups.
A 3D group is a group of frames that are stacked to form a 3D volume. In the default class hierarchy, the "Series" class is the "group" (the childs of the "Series" are the frames.) If you want to change that, you can change the class hierarchy in the "Class Management (2D)" mode. Please consult the "SliceOmatic 3D groups" web page for more informations on the 3D groups.
Note:
|
|
|
Differences between IBSI and TomoVision values.
The goal of Radiomics is to have a bunch of values that we hope can be used to train an AI to recognize pathologies in a specific region of interest. IBSI define more than one hundred of these. However, most of the measurements they define give results that are way to big or to small for an AI to use! You have to understand, for an AI to work, all the data it received must be in the same range, preferably between -1 and 1. If some values are higher, they will overshadow the others and skew the results. Of course, these can be normalized when you train the AI, but it is then normalized "after the fact" on the data sample used for the training. With this in mind when you place the module in "TomoVision" compatibility mode, I change some of the computation to try to get the values in a more "AI Friendly" range. The values will then lose most of their meaning for humans, but since the intended audiance is an AI anyway, I am not losing much sleep over this. To underscore the fact that these are not the original IBSI computation, I add "T_" in front of the 4 letter IBSI nomenclature for each measures. (ex: "T_W4KF" instead of "W4KF").
I have a discussion of how I compute the "TomoVision" values at the end of this section.
Also, IBSI has a lot of measurements based on textures and textures variations, but no measures using the frequency domain of the ROI. So, I add a few FFT measures. I have a discussion of how the FFT is computed at the end of this section.
From the Graphic Interface
|
|
|
|||||
ROI mask |
The Region Of Interest is composed of all the voxels under a specific TAG. This is where you specify the TAG to use.
|
|||||
Config |
Open the configuration interface
|
|||||
Measures |
Open an interface that enable you to select/de-select the Radiomics measurements that will be computed
|
|||||
View ROI |
View the different aspects of the ROI. This button is only available once you performed the "Compute" operation
|
|||||
Save ROI |
Save different aspects of the ROI. This button is only available once you performed the "Compute" operation
License:
|
|||||
View Results |
View the numerical values of the computed Radiomics measurements. This button is only available once you performed the "Compute" operation
Note:
|
|||||
Compute |
Compute the ROI and the selected measurements for this ROI. |
|||||

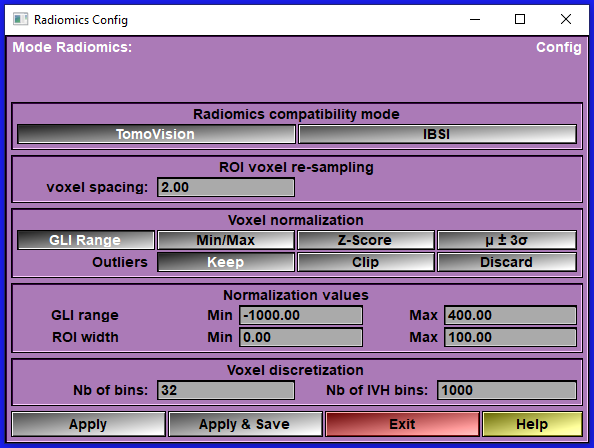
The "Config" interface
This interface enable you to configure the different Radiomics parameters use when computing the Radiomics values.
|
|
|
|
Compatibility mode |
Select between the "TomoVision" and "IBSI" modes.
|
|
ROI voxel dim |
The Radiomics ROI is a re-sample volume where the voxels are isotropic. You must specify the dimension (in mm) of the voxel's sides.
|
|
Interpolation |
(IBSI only) IBSI specify 3 types of possible interpolation when re-sampling the ROI voxels. Closest neighbours, linear interpolation or cubic interpolation. I have provided all of these here for compatibility. I also added the "TomoVision" mode.
Please note that I do not agree with the authors of IBSN on this subject. I do not think you should be interpolation when the re sample voxels are bigger than the original. In that case, you do not want to "interpolate" between voxels, you want to "integrate" over the volume of the new voxel. Interpolation should only be used for the direction of the re-sample voxels where the original dimension is larger than the re-sample dimension.
In the "TomoVision" re-sampling mode, I do either interpolation or integration independently in each of the 3 axis. And when I do interpolate, I use none of the 3 techniques proposed by IBSI but I use a cubic spline (2s3 - 3s2 + 1) to interpolate between the adjacent voxels (You can see this as a mix between "Linear" and "Cubic" modes of IBSI).
|
|
Voxel normalization |
(TomoVision only) Keeping in mind that we want values that can be used with an AI, we will normalize the GLI values inside the ROI. We have different options for this.
For CT images, we will want to normalize the GLI values using a fixed range of HU values. These are defined in the first line of the "Normalization Values" box. For other modalities, you may want to normalize using the minimum and maximum GLI values present in the ROI. Or, you can normalize using a "Z-Score" algorithm (values between μ ± σ will be rescale to the range 0 to 1) and to keep some compatibilities with IBSI, we also offer to normalize between μ ± 3σ.
If you select "GLI range", "Z-Score" or "μ ± 3σ", then some values may be outside the 0 to 1 range. You have a choice to keep them, clip them to the range 0 to 1, or discard them. The discard option is implemented by assigning these voxels the TAG value 255.
|
|
Normalization values |
These values are used to normalize the Radiomics results to make them compatible with AI usage.
The GLI range Min and Max values are used if the Voxel normalization mode is "GLI Range".
The ROI width Min and Max values are used to normalize the distances, surface and volumes computed in the "HCUG" (Morphological) group.
|
|
Voxel re-segmentation |
(IBSI only)
|
|
Voxel discretization |
A number of Radiomics values are computed from discretized values of the ROI.
In IBSI mode, you have 3 possible ways to discretized the GLI values: With a fixed number of bins, a fixed size for each bins, starting from a predefined value (the "Range Min" in the Voxel re-segmentation box), or a fixed size for each bin starting from the minimum GLI value in the ROI.
In TomoVision mode, since the GLI values are already normalized, we only use the fixed number of bins method.
|
|
IVH-discretization
|
The IVH discretization is used to compute the IBSI values of group P88C (Intensity-volume histogram). IBSI describe 3 modes for this computation.
In the TomoVision mode, since this is computed from normalized data, we only use the mode "Arbitrary" with a 1000 bins.
|
|
Apply |
Apply your choices for this sliceOmatic session only.
|
|
Apply & Save |
Apply your choices and save them in the "Radiomics_Config.scp" file in your scratch directory. Your choices are now the default choices each time you re-start sliceOmatic.
|
|
Exit |
Exit the configuration interface.
|
|
Help |
Open a web browser to this page. |
|

The "Measures" interface
This interface is used to enable / disable specific measures or group of measures. For example, if you have big ROI, the HCUG/N365 and HCUG/NPT7 values make take a looooogn time to compute. You may want to disable them.
|
|
|
|
List |
List of all available Radiomics measures. The list is presented with a "Group" / "Measure" hierarchy using the IBSI 4 letter syntax. Some measures are disabled in the list. These are either measures that have been defined in IBSI but are defined as "This feature currently has no reference values and should not be used.", or values that did not make sense to me (HCUG/KLMA).
|
|
Description |
A text description of the matching item in the list.
|
|
Select All/None |
|
|
Default |
Set the default values.
|
|
Apply |
Apply your choices for this sliceOmatic session only.
|
|
Apply & Save |
Apply your choices and save them in the "Radiomics_Measures.scp" file in your scratch directory. Your choices are now the default choices each time you re-start sliceOmatic.
|
|
Exit |
Exit the Measures interface.
|
|
Help |
Open a web browser to this page. |
|

The "Compute" button
This button start the computation of the Radiomics values for all selected 3D groups, using the selected TAG to create the ROI.
While the computation is running a progress window will pop-up.
|
|
|
|

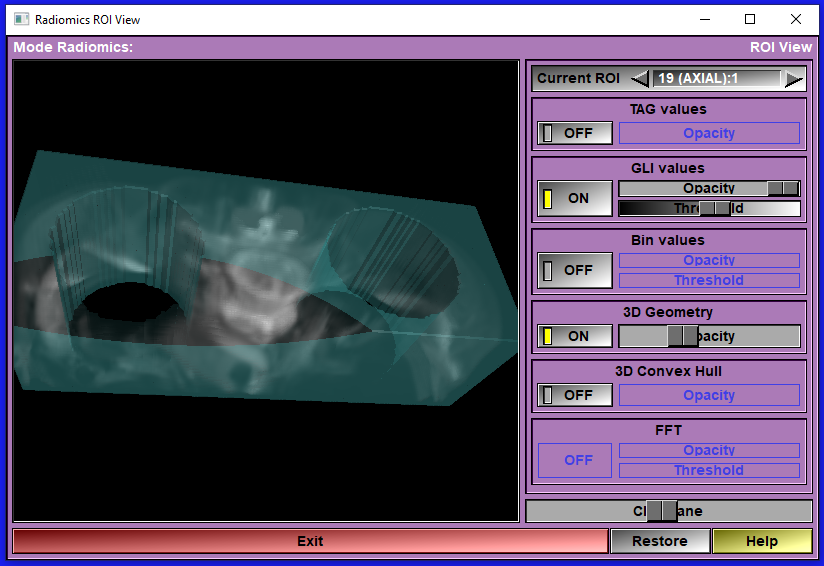
The "View ROI" interface
Activating the "View ROI" button open a new window that let you see and manipulate different aspects of the ROI in 3D. The 3D view is computed by raytracing. Depending on the size of the window and the speed of your computer, This technique can be slow. When manipulating the 3D view, the image will be displayed at a lower resolution and the resolution of the finished image will be progressivelly increase after you stop interacting with the view.
You can display: The TAG values, the GLI values, the Bin values of the ROI. You can also display the 3D geometry reconstructed from the TAG and the convex hull of that geometry. You can aslo view the amplitude of the FFT of the GLI in the ROI.
Please note that these 6 options are only available if the corresponding data has been calculated. For example, if you disabled the computation of the "HCUG" (Morphological) group, then the 3D geometry and its convex hull are not available.
You can manipulate the 3D view using the same mouse interaction as in the other sliceOmatic 3D windows. The left mouse button activate the rotations, the right mouse button activate the translations and the center, or both left&right at the same time, the scaling. The transformation matrix can also be restored with the "Restore" button.
|
|
|
|
Current ROI |
It is possible to have multiple Radiomics ROI available at the same time. If you have multiple 3D groups and/or multiple TAGs that have been used to compute the Radiomics values. You can select which ROI you want to view with this tool
|
|
TAG values |
This button and slider control the viewing of the TAG values in the ROI.
|
|
GLI values |
This button and slider control the viewing of the GLI values in the ROI. You can also change the threshold use when displaying the GLI values of the ROI. The GLI values will be shown in levels of greys.
|
|
BIN values |
This button and slider control the viewing of the Bin values in the ROI. You can also change the threshold use when displaying the Bin values of the ROI. The Bin values will be shown using a "Hot Metal" color map.
|
|
3D Geometry |
This button and slider control the viewing of the Geometry constructed from the ROI.
|
|
Convex Hull |
This button and slider control the viewing of the convex hull of the geometry constructed from the ROI.
|
|
FFT |
This button and slider control the viewing of the FFT values in the ROI. What is actually displayed is the logarithm of the amplitude of the FFT log(1+sqrt(real2 * imaginary2)). You can also change the threshold use when displaying the FFT values of the ROI. The FFT values will be shown using a "Hot Metal" color map.
|
|
Exit |
Exit the ROI View interface.
|
|
Restore |
Restore the transformation matrix. This will re-center the view and reset any rotations.
|
|
Help |
Open a web browser to this page |
|
The "Save ROI" interface
You can save different aspects of the ROI to file.
|
|
|
|
Current ROI |
It is possible to have multiple Radiomics ROI available at the same time. If you have multiple 3D groups and/or multiple TAGs that have been used to compute the Radiomics values. You can select which ROI you want to save with this tool
|
|
TAG values |
Enable the creation of a file containing the TAG values inside the ROI. You have a choice of "TomoVision" or "NIfTI" file formats. The data will be saved using one unsigned character (8 bits) per voxel.
|
|
GLI values |
Enable the creation of a file containing the GLI values inside the ROI. You have a choice of "TomoVision" or "NIfTI" file formats. The data will be saved using one IEEE float value (32 bits) per voxel.
|
|
Bin values |
Enable the creation of a file containing the Bin values inside the ROI. You have a choice of "TomoVision" or "NIfTI" file formats. The data will be saved using one integer (32 bits) per voxel.
|
|
3D Geometry |
Enable the creation of a file containing the Geometry of the ROI. You have a choice of "MOVIE.BYU" or "STL Binary", "STL ASCII", Wavefront "OBJ", Autocad "DXF" or VRML "WRL" file formats.
|
|
Convex Hull |
Enable the creation of a file containing the convex hull of the geometry of the ROI. You have a choice of "MOVIE.BYU" or "STL Binary", "STL ASCII", Wavefront "OBJ", Autocad "DXF" or VRML "WRL" file formats.
|
|
File path |
Specify the directory where the files will be saved.
|
|
File name |
Specify the root name used in saving the files.
|
|
Save |
Create the files for the selected options.
|
|
Exit |
Exit the ROI Save interface.
|
|
Help |
Open a web browser to this page. |
|

The "View Results" interface
You can view the computed Radiomics results for all the active ROI.
Note:
|
|
|
|
|
|
||
List |
List of all available Radiomics measures. The list is presented with a "Group" / "Measure" hierarchy using the IBSI 4 letter syntax. Some measures are disabled in the list. These are either measures that have been defined in IBSI but are defined as "This feature currently has no reference values and should not be used.", or values that did not make sense to me (HCUG/KLMA).
|
||
Description |
A text description of the matching item in the list.
|
||
Values |
The numerical values of the matching item in the list. If more than one ROI is currently active (multiple 3D groups selected and/or multiple TAGs used), then each of the active ROI will have a result column. The name of the ROI's 3D group along with the TAG used in this ROI will be displayed at the top.
License:
|
||
Exit |
Exit the "View Results" interface.
|
||
Help |
Open a web browser to this page. |
||

Saving the Radiomics results from the "Results 3D" interface.
Once the Radiomics Module is installed, the "Rsults (3D)" tool will have a "Radiomics" section in its list of available cells. You can select from the values you want to export from this list.
|
|
|
|

The TomoVision values.
As discussed earlier, in compatibility=TomoVision, I try to keep all computed values as close as possible to the -1 to 1 range. The IBSI measurements that are already in that range are unchanged, but for the measurements that are outside the range, I normalize some of the values used in the measurement to stay as close as possible to the -1 to 1 range.
For the HCUG (Morphological) group, this is done with the help of the "ROI Width" "Min" and "Max" parameters in the configuration. All distances measures are normalized to the range Min/Max. All surfaces are normalized between 6*Min2 and 6*Max2 (the surface of a cube of side Min/Max) and all volumes are normalized between Min3 and Max3 (the volume of a cube of side Min/Max).
For the 9ST6 (Local Intensity) and UHIW (Intensity stats) groups, I normalize the GLI values of the ROI using the normalization specified in the configuration (Range. Min/Max, Z-Score or μ ± 3σ).
For the ZVCW (Intensity histogram) group, I simply divide the bins values by the number of bins.
For the P88C (Intensity histogram) group, The IVH discretization is computed from the normalized voxel values. I use the IBSI "Arbitrary" mode with 1000 bins. And these are expressed as values from 1/1000 to 1.
For the LFYI (grey level co-occurence) group, when the values are computed from a sum of values, I will divide by the number of bins to keep the results close to the -1 to 1 range. When it involve a sum of squared values, I will divide by half the number of bins squared. (nb_bin/2)2.
For the TP01 (grey level run-length), 9SAK (Grey level size zone), VMDZ (Grey level distance zone) and REK0 (Neighbouring level dependence) group, I compute a normalized matrix by dividing by the max value in the matrix. The "Variance" and "Log" computations are done with this normalized matrix. For most of these values, I will also divide by the number of entires in the matching vectors, and when computing sums of "i squared" time "X", I will used a normalized "I" ( I2 become (i/n)2 ).
For the IPET (Neighbourhood tone difference) group computations are not changed.
The FFT measurements.
TomoVision introduce a new set of measurements in the Radiomics module: The FFT measurements.
Computing a 3D FFT of a uniform volume is fairly straight forward. The problem we have here is that the volume can have multiple small details since it is created from the TAG values. Each of these details introduce high frequency content that are independent of the GLI values themselves. And we want to get an FFT of the GLI, not of the TAG. So, the first thing we do is a mathematical morphology "close" operation to remove any holes in the ROI that are smaller than a fixed limit (by default the size of the Hamming window = 5 voxels). We also include voxels outside the ROI, but decrease their contribution using a sin function. The width of this "border" is again the width of the Hamming window (default = 5 voxels). We can now compute the FFT from these values. But we may still have some artifact due to the clipping on the borders of the ROI. So wen computing the FFT values, we will discard a 3 voxel wide band of FFT values around the "0" planes in the 3 axis directions (any clipping artifact will be found there).
You can also look at the section "Noise FFT" for a discusion of a similar problem in 2D.
The FFT values used in the computation is the amplitude of the signal (sqrt(real2 * imaginary2)). When we display the FFT (in "ROI View") we will use the logarithm of these values.
The FFT values are first summed in bins (8 bins) according to their distance from the center of the FFT volume. The center of the volume is where the DC component of the signal is, the further out you go, the higher the frequency. So, the 8 bins represent the amplitude of the signal at different frequencies. We then compute the ratio of the values each of these bins on the total sum of the FFT values. This gives us the FFT1 to FFT8 values.
Next we compute the PCA of the FFT values. We compute the PCA for all FFT values that have an amplitude greater than the mean value:
FFTG is the major axis length
FFTH is the minor axis length
FFTI is the least axis length
FFTJ is the elongation
FFTK is the flatness of the PCA
And finally we have some values from the FFT amplitudes:
FFTL is the mean FFT amplitude
FFTM is the amplitude variance
FFTN is the median amplitude
FFTO is the root mean square amplitude.
From the Display Area
There is no display area interaction specific to this mode.
From the Keyboard
There is no keyboard interface specific to this mode.
From the Command Line
System Variables defined in this library:
|
|
$RADIOMICS_MODE |
(U8) |
TomoVision compatibility mode: 0=IBSI, 1=TomoVision |
|
|
$RADIOMICS_HAMMING |
(I32) |
FFT Hamming window width (default=5) |
|
|
$RADIOMICS_STACK |
(U32) |
Minimum stack size for recursive computations (default=10*1024*1024) |
Commands recognized in this mode:
RADIomics: config name value [value...]
This command is used to save the configuration options. The accepted "names" are:
|
|
Name |
Value(s) |
Description |
|
|
mode |
mode |
Set the TomoVision compatibility mode, The expected values are "TomoVision" or "IBSI". |
|
|
dim |
size |
Set the voxel size value (in mm) |
|
|
interpol |
mode |
Set the interpolation mode for IBSI mode (1=Linear, 2=Closest neighbour) |
|
|
reseg |
outliers, range, 3-sigma |
Set the Re-segmentation parameters. - outliers: keep (=0), clip (=1) or discard (=2) voxels outside the specified range. Note: in compatibility=IBSI, outliers are always discarded. - range: Act on voxels outside the specified range (=1) or not (=0), - 3-sigma: Act on voxels outside the μ ± 3σ range (=1) or not (=0). Note: The Outliers term is also used for the voxel outside the normalization range in compatibility=TomoVision. |
|
|
range |
min, max |
Set the GLI range when using CT data (in HU). |
|
|
norm |
mode |
Set the GLI normalization mode in compatibility=TomoVision. (1=Range, 2=Min/Max, 3=Z-Score, 4=μ ± 3σ). |
|
|
dist |
min, max |
Set the minimum and maximum size of the ROI (for normalization in compatibility=TomoVision) (In mm) |
|
|
bin |
mode, nb, size |
Set the discretization mode (0=nb of bins, 1=fixed bins starting at range min, 2=fixed bins starting at ROI min), number of bins (for mode=0), and bin size (for modes 1 & 2). |
RADIomics: measure name (on|off)
Activate or de-activate the specified measure. "Name" is the 4 character code used in IBSI.