SliceOmatic uses its own set of graphical interface tools. Here is a brief description of the different tools you will encounter.
The Basic tools
The basic tools, defined in the TomoVision_Tools.dll library are:
|
Buttons |
Buttons can be activated by clicking the left mouse button. A button will change color when the mouse pointer is over it. Once activated, a button will look depressed and its text will be white.
If a button appears as only a red outline, it cannot be activated.
Some buttons have yellow indicator light to indicate their state. The state can be toggled ON or OFF by clicking the button.
|
||||||||||||||||||
|
Button Lists |
Button lists are used to group many buttons together. If there are more buttons than can be displayed at one time, a slider will appear on the left side of the list. This slider can be used to scroll the list.
You can also use the mouse wheel when the cursor is over the tool to scroll through the list.
|
||||||||||||||||||
|
Check Boxs |
This tool are used to check item in a list. There's 2 variation of this tool, in the first one you can check as many items as you which in the list. Each selected item will have a yellow indicator.
In the second variation, you can only select one item at a time. Selecting an item will automatically deselect the other ones. the selected item will have a yellow indicator.
|
||||||||||||||||||
|
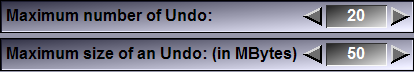
Selection |
This tool enables you to chose a value from a list of possible values. You can use the arrow keys on both side of the current value to scroll through the possible values.
You can also use the mouse wheel when the cursor is over the tool to scroll through the possible values.
|
||||||||||||||||||
|
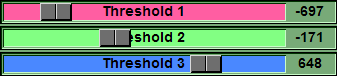
Sliders |
Parameters controlled by a slider can be modified either by clicking the left mouse button when the mouse pointer is over the desired portion of the slider, or by clicking and dragging the cursor of the slider with the mouse pointer. A slider will change color when the mouse pointer is over it.
Some sliders will also display their current values numerically.
When the mouse pointer is over the slider, you can also increase or decrease the slider’s value with the keyboard.
In many instances, the width of the cursor is proportional to the range of values represented by the slider. Thus, for the Slice Selection slider, if the total number of slices is four, the cursor will be one fourth the length of the slider.
You can also use the mouse wheel when the cursor is over the tool to change the slider's value.
|
||||||||||||||||||
|
Color |
The Color editor tools enable you to select a color either by changing the "RGB" (Red, Grn, Blue) values with 3 sliders. A box on the right hand side show the resulting color.
Alternatively, by clicking the right hand side button, you can place the tool in "HLS" (Hue, Light Saturation) mode and specify the color with these 3 values.
|
||||||||||||||||||
|
Hue |
The Hue tool let you specify a color by changing the its Hue parameter. The box on the right hand side show the resulting color.
|
||||||||||||||||||
|
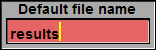
Text Input |
These windows are used to prompt the user for textual information.
You must place the mouse pointer over the window and type the information on the keyboard. Pressing the "Enter" key will signal the window that the text has been entered. You can use the arrow keys to move inside the text and the backspace and delete keys to edit the text. The vertical arrows are used to recall previously entered text strings.
|
||||||||||||||||||
|
Text Windows |
These windows are used to display textual information. If a slider appears to the left or the bottom of the window, it can be used to scroll through the text.
|
||||||||||||||||||
|
Command Line |
At the bottom of the main text window, there is a text input line where you can enter command lines for the program. |


SliecOmatic's Tools
More complex interface tools are also used in some of the sliceOmatic modules. These are defined in the sliceO_Structure.dll library. They are:
|
This tool is used to select a brush size when in a mode that use a brush to interact with the images.
You have the choice between 6 brushes, the smallest is a single pixel, the second is 3x3 pixels... up to a 20 pixel wide circle. The brushed in the tool will be of the color of the currently selected TAG value.
You can use the F5 to F10 keys as keyboard shortcuts to select the brushes:
You can also control the brushes through the command interface, see Appendix A for more information
|
|||||||||||||||||||||||
|
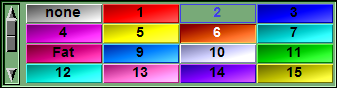
This tool is used to select the current TAG value. Each of the available TAG values has a button.
If a TAG value is locked (see TAG Lock Tool), its button will be unavailable (ex: TAG 2 in the demo image).
The currently selected TAG value will have its button depressed (ex: TAG 6 in the demo image)
You can use the 0 to 9 keys as keyboard shortcuts to select the first 10 TAGs:
You can assign labels to the TAGs (ex: TAG 8 = "Fat" in the demo image). To assign a label, you can either do it with a command in the command line, or by clicking with the right mouse button on the TAG's button.
In the 3D modes, the TAG Selection window is used to enable TAGs for 3D operations. A yellow indicator mark the selected TAGs. TAGs that can not be selected will be unavailable.
You can also control the TAGs through the command interface, see "SliceO_System\Tag.dll" for more information.
|
|||||||||||||||||||||||
|
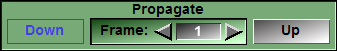
In some modes, you can use the values from one frame as a starting point for the values of another frame. The propagate tool let you select the "source" frame and propagate the values from this frame to a "target" frame (either "Up" or "Down").
You can only propagate among frames that the children of the same class. So for example, if the Class tree has 3 levels: "Root", "Study" and "Frames", you will only be able to propagate among the frames of the same study.
The Propagate tool offer you to propagate "Down" (next child) or "Up" (previous child) from the "source" frame selected in the middle portion of the interface. You can change the "source" frame either from the image area (selecting the current frame), or with the arrow buttons. Changing the frame selected in the middle section does not propagate anything, only the "Down" and "Up" buttons do.
|
|||||||||||||||||||||||
|
|
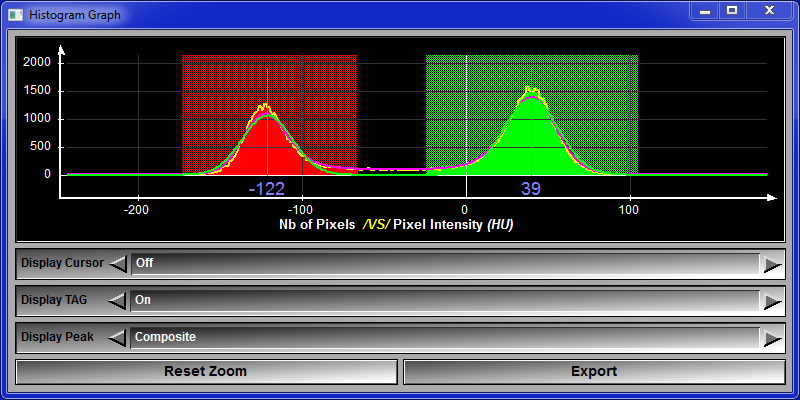
Some tool or modes display an histogram of the image. This is a graph showing how many pixels are present for each of the possible pixel's values. The number of pixels is the vertical axis and the range of pixel values is the horizontal axis.
This is useful to fix threshold values, since the peaks in the graph represent the different tissues in the image. A slider on the right hand side can be used to change the vertical scaling of the histogram. When you move the cursor over the image in the display area, a vertical white line show the value of the pixel under the cursor. In modes where you adjust threshold values, the pixel values covered by the threshold will be highlighted with the color associated with the threshold.
When the cursor is over the tool, the mouse wheel can be used to change the vertical scaling. Clicking on the "Blow" button will open a new window displaying the histogram. From that window, you can zoom on a section of the histogram and export the histogram data. If the module producing the histogram has computed it, you can also display the Gaussian peaks that best fit the histogram. |