In this mode, you create segmented TAG images from the GLI Images (Grey Level Images).
Peaks in the histogram are detected by looking for zero crossing of the first derivative. The histogram recursively filtered until the target number of peaks are detected. Thresholds are then computed from these peaks. The threshold value between 2 peaks will be the minimal value of the histogram between these peaks.
You can select if you want the histogram to be computed from the complete GLI image, or just the pixels under a specific TAG.
From the Graphic Interface
|
|
|
|
|
|
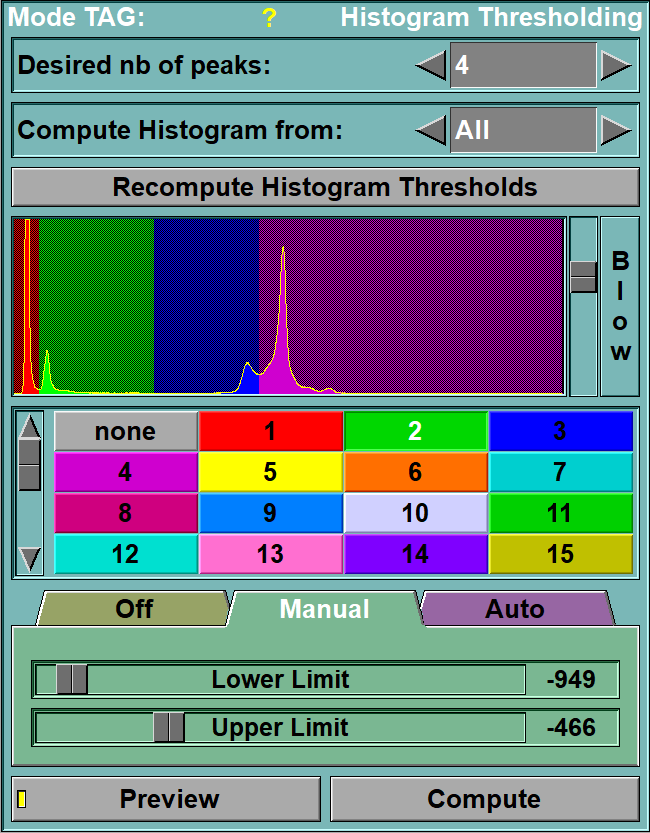
with B&W images |
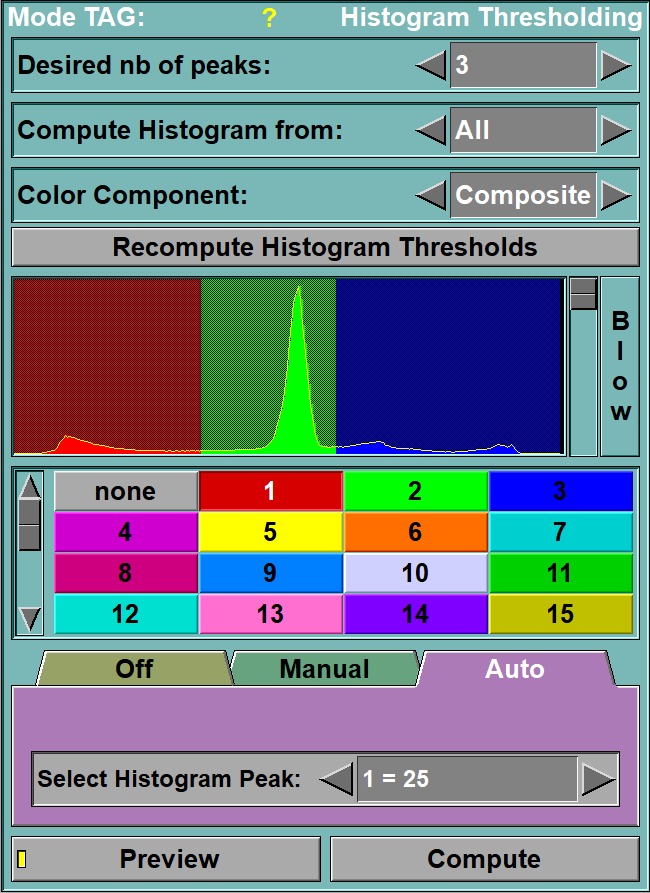
With RGB images |
|
Nb of peaks |
You need to specify a target number of peaks to detect. The actual number of peak detected may be larger than the desired target.
|
|
Histogram From |
By default the histogram is compute from the grey level value of all the pixels of the selected frames. But with this tool, you can restrict the pixels used to compute the histogram to the pixels under one of the existing TAG values in the image.
|
Color Component |
If one of the loaded slices has color components (ex: JPEG images), then you have the option of applying the clipping values to either one of the colors (Red, Green or Blue) to the maximum of the 3 colors (Max) or to the composite value (Composite).If all the images are B&W (ex: CT or MR) this interface component is not present.
|
|
Recompute |
If you modify the value of the preceding tool ("Compute Histogram from", you need to re-compute the histogram to actualize these changes. Once the peak have been detected, they will be assigned by default to the first TAG values.
Ex: if the program detected 3 peaks, TAG 1 will be assigned to the threshold values of the first peak, TAG 2 to the second peak and TAG3 to the third peak.
|
|
Histogram box |
Display the histogram of the grey values of the GLI image(s). The vertical axis represents the number of pixels having a particular value, while the horizontal axis represents the possible values of the pixels (from Minimum at left to Maximum at right). The colors under the line correspond to the segmentation values fixed by the sliders. When the cursor is over an image, the GLI value of the pixel under the cursor can be seen as a vertical bar on the histogram. This tool is also described in the "Interface tools" section of the introduction
|
|
TAG Value |
Select the current Tag value. This tool is also described in the "Interface tools" section of the introduction
|
|
Segmentation Mode |
For each TAG value, you can select one of 3 segmentation modes: •Off: The TAG is not used in the segmentation •Manual: You manually select the lower and higher threshold values for this TAG •Auto: The threshold values will be assigned one of the histogram peak.
|
|
Preview |
Toggle the preview mode. When on, the indicator on the button light up and the TAG displayed in the 2D windows will reflect the threshold selection.
|
|
Compute |
Pressing the Compute button will perform the real segmentation and create the TAG images.
|
From the Display Area
There is no Display Area interaction specific to this mode.
From the Keyboard
In addition to the keyboard shortcuts seen in section 5.2.0.3, the following keyboard keys , Specific to Thresholding, can also be used as a shortcut:
|
|
|
|
|
|
Key map |
Action (While the cursor is over one of the Threshold sliders) |
|
|
|
|
|
|
"Scroll Lock" |
Lock or Unlock the slider under the cursor. |
|
|
“Up Arrow" |
Decrease the TAG value associated with the slider under the cursor |
|
|
“Down Arrow” |
Decrease the TAG value associated with the slider under the cursor |
From the Command Line
Text commands recognized in this module:
Histo: Compute
Compute the segmentation.
Histo: t_tag Mode (Off|Manual|Auto)
This will set the mode for all TAGs matching "t_tag".
Histo: t_tag Min value
This will set the lower threshold values for all TAGs matching "t_tag" if these TAGs are in mode manual.
Histo: t_tag Max value
This will set the lower threshold values for all TAGs matching "t_tag" if these TAGs are in mode manual.
Histo: t_tag Peak value
This will assign the peak "value" to all TAGs matching "t_tag" if these TAGs are in mode Auto.
Histo: t_tag Width value
This will assign the width "value" to all TAGs matching "t_tag" if these TAGs are in mode Auto.
Histo: t_tag Slider (*|min|max) (lock|unlock|toggle)
Lock or unlock the sliders for the lower and higher thresholds of the TAGs matching "t_tag"
|
|
|