If you have a problem with the program, it is possible that we will ask you to generate a trace. Traces are reports of what the program was doing when you encounter the problem.
The first step is to open the trace interface. There's 2 way to do this:
•Directly from the keyboard by typing both the "Ctrl" key and a number "1" to "9". The number you use will preset the trace level in the interface.
•Trough the debugging interface by typing both the "Ctrl" and the "d" keys at the same time.
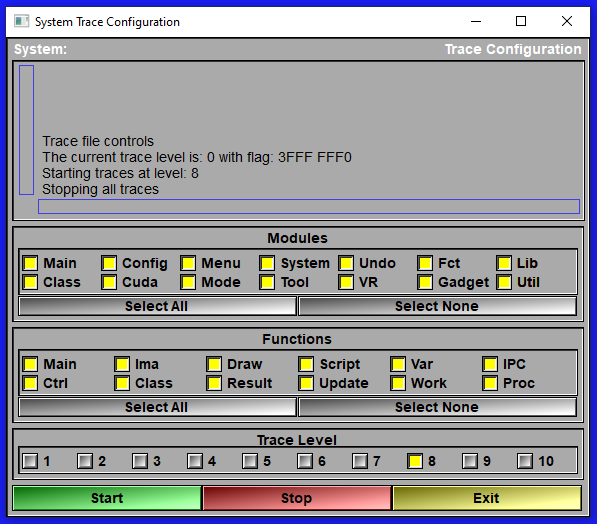
The Trace Interface (Started with "Ctrl-1" to "Ctrl-9" or the "New Trace" button in the debugging interface)
|
|
|
Text window |
Some feedbacks, like start and stop...
|
Modules |
You can restrict the trace to certain modules of the program. The choices are: Main All the modules that start and stop sliceO along with the main loops Class All the modules that work with the classes Config The configuration menu and its modules Cuda All Cuda modules Menu The Main menu and its modules Mode The differnt modes DLLs System The system DLLs Tool The different tools DLLs Undo The undo/redo operations and menus VR All VR modules Fct Members of the "Module_Structures" DLL. Gadget The program's gadgets (like the tag and brush selection tools) in the "Module_Tools" DLL Lib All the internal libraries used by the program (Lib_*.dll) Util Un-used at this time
|
Functions |
You can restrict the trace to certain functions within the desired modules of the program. The choices are: Main All the functions that start and stop sliceO along with the main loops Ctrl All the functions that are used in the module's interfaces Ima All the functions that display images to the screen Class All the diffent classes Draw All the functions that draw to the image window Result All the functions that are associated with the "Results" tools Script All the functions that read/write scripts Update Inside each modules, tehre is an "Update" function that react to external changes Var All the functions that read/write to system variables Work Any function in a module that do the actual computation for that module IPC The "Inter Process Communication" tools used to synchronyse the processes Proc Window's "Proc" functions.
|
Trace Level |
You can also restrict the trace to certain "levels". The higher the trace level, the more detailed will be the trace. But higher level traces will generate huge trace files and will also slow down the program. User the higher levels when you start the trace close to the problem you have. For example if you have a problem when you click on the "Erosion" button of the Morpho mode, start sliceOmatic, load you image, go to the Morpho mode and start the trace just before you click on the "Erosion" button. Stop the trace immediately after your problem show up! On the other hand, if your problem is a crash of sliceOmatic, then you do not have to stop the trace, the crash did that for you.
|
Start |
Start the trace for the selected modules and functions at the selected trace level. The trace will be called "sliceOmatic_trace.dat" and it will be placed in your "Scratch" directory (by default, Documents/TomoVision)
|
Stop |
Stop the trace
|
Exit |
Exit the interface |
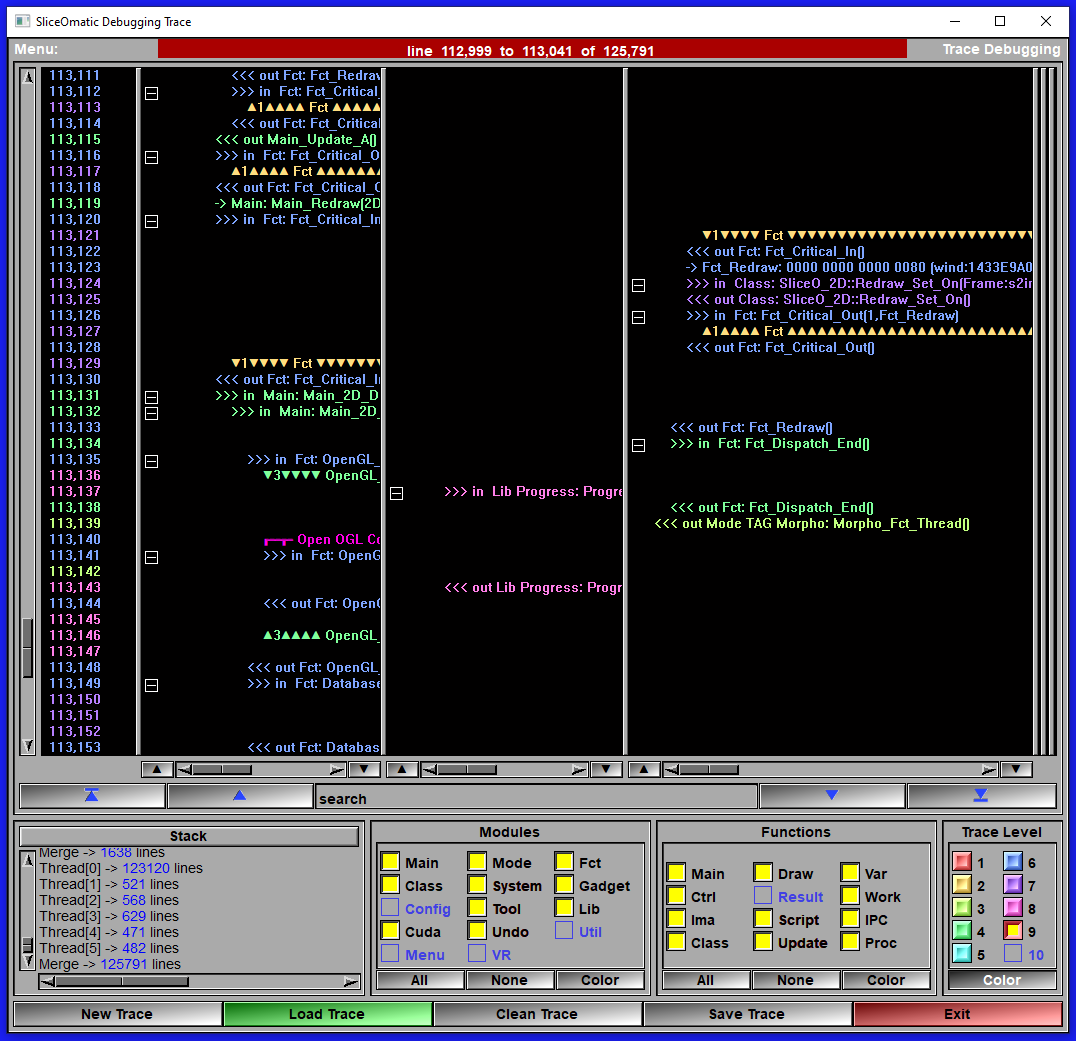
The Debugging Interface (Started with "Ctrl-D")
|
|
|
Line summary |
Tell you what is the currently selected trace line and the total number of lines.
|
Main window |
This section is split in 2 to n sub-windows. The left one is the trace line number, the second one is the main trace. If sliceOmatic spawn a sub-process, it will have its own sub-window. You can resize any of the sub-windows by moving the separator bar between sub-windows.
|
Up/Down and pan |
At the bottom of each sub-window, you have a up and down arrow. These can be used to go to the first or last line of trace present in the sub-window. You can also use the "pan" slider to pan the text horizontally inside the each sub-window.
|
Search |
The search interface enable you to search for text in the trace,
|
Stack |
This window show you the current stack nesting of the functions for the current selected line in the trace.
|
Modules |
This group enable you to add/remove traces lines specific to certain modules. You can also assign colors to the trace lines according to the module they belong to. Only the modules present in the trace can be selected.
|
Functions |
This group enable you to add/remove traces lines specific to certain functions. You can also assign colors to the trace lines according to the functiopn they belong to. Only the functions present in the trace can be selected.
|
Trace Level |
This group enable you to add/remove traces lines specific to certain trace levels. You can also assign colors to the trace lines according to the level they belong to. Only the levels present in the trace can be selected.
|
New Trace |
Open the trace interface. The default Modules, Functions and levels of the trace interface will be set to the values from the debugging interface.
|
Load Trace |
Load the latest trace file generated (from "sliceOmatic_trace.dat" in your "Scratch" directory).
|
Clean Trace |
Traces tend to be very repetitive. This will remove duplicated lines in the trace. It wil only keep the fisrt and last 5 instances of any specific lines or group of lines. Since we usually want to see what the program was doing at the time of a crash, this is more than enough.
|
Save Trace |
Save a copy of the trace to the desktop. This is the file you should send to TomoVision.
|
Exit |
Exit the debugging interface.
|
Note:
|
|
|