The Debug Window
The Debug Window is used to analyze the traces files.
There's 2 way to open the Debugging Window:
•By clicking the "Debug Wnd" button of the File/Debug group.
•Directly from the keyboard by typing both the "Ctrl" key and "d" at the same time.
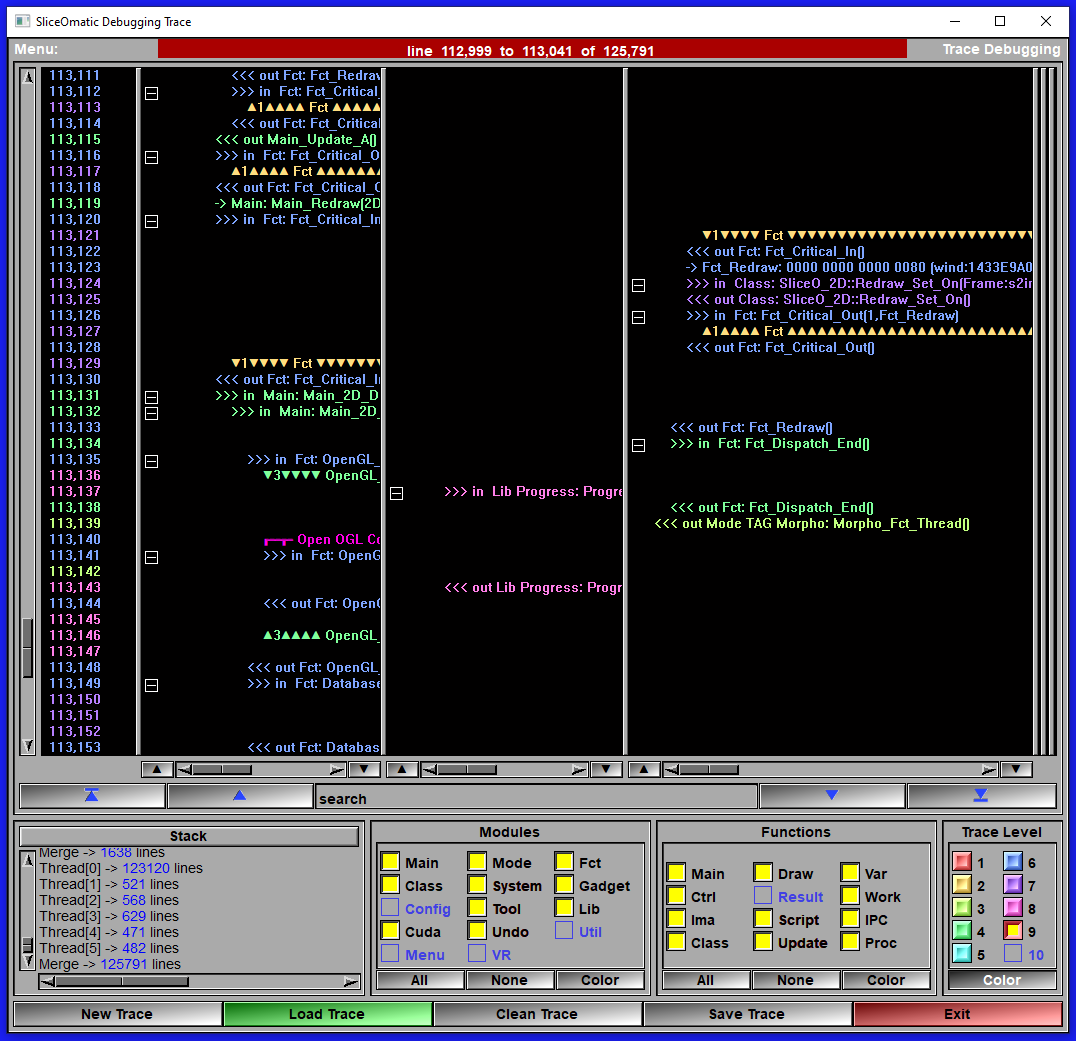
The Debug Window Interface
|
|
|
Line summary |
Tell you what is the currently selected trace line and the total number of lines.
|
Main window |
This section is split in 2 to n sub-windows. The left one is the trace line number, the second one is the main trace. If sliceOmatic spawn a sub-process, it will have its own sub-window. You can resize any of the sub-windows by moving the separator bar between sub-windows.
|
Up/Down and pan |
At the bottom of each sub-window, you have a up and down arrow. These can be used to go to the first or last line of trace present in the sub-window. You can also use the "pan" slider to pan the text horizontally inside the each sub-window.
|
Search |
The search interface enable you to search for text in the trace,
|
Stack |
This window show you the current stack nesting of the functions for the current selected line in the trace.
|
Modules |
This group enable you to add/remove traces lines specific to certain modules. You can also assign colors to the trace lines according to the module they belong to. Only the modules present in the trace can be selected.
|
Functions |
This group enable you to add/remove traces lines specific to certain functions. You can also assign colors to the trace lines according to the function they belong to. Only the functions present in the trace can be selected.
|
Trace Level |
This group enable you to add/remove traces lines specific to certain trace levels. You can also assign colors to the trace lines according to the level they belong to. Only the levels present in the trace can be selected.
|
New Trace |
Open the trace interface. The default Modules, Functions and levels of the trace interface will be set to the values from the debugging interface.
|
Load Trace |
Load the latest trace file generated (from "sliceOmatic_trace.dat" in your "Scratch" directory).
|
Clean Trace |
Traces tend to be very repetitive. This will remove duplicated lines in the trace. It will only keep the first and last 5 instances of any specific lines or group of lines. Since we usually want to see what the program was doing at the time of a crash, this is more than enough.
|
Save Trace |
Save a copy of the trace to the desktop. This is the file you should send to TomoVision.
|
Exit |
Exit the debugging interface.
|
Note:
|
|
|