The Trace Control
If you have a problem with the program, it is possible that we will ask you to generate a trace. Traces are reports of what the program was doing when you encounter the problem.
The first step is to open the trace interface. There's 3 way to do this:
•By clicking the "Trace Ctrl" button of the File/Debug group.
•Directly from the keyboard by typing both the "Ctrl" key and a number "1" to "9". The number you use will preset the trace level in the interface.
•Trough the "Debug Wnd" interface by clicking the "New Trace" button.
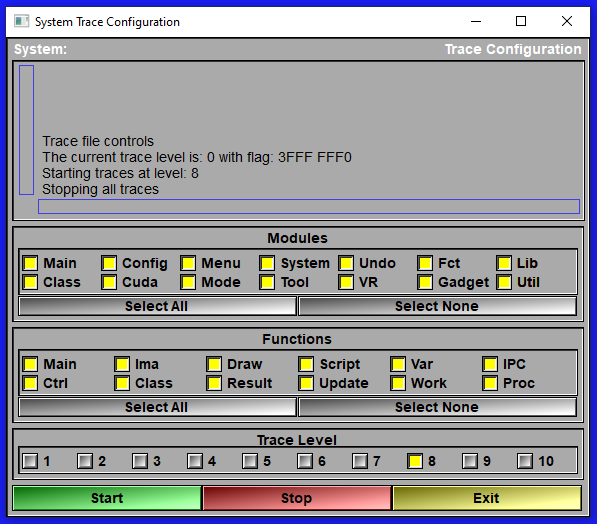
The Trace Interface (Started with "Ctrl-1" to "Ctrl-9" or the "New Trace" button in the debugging interface)
|
|
|
||||||||||||||||||||||||||||
Text window |
Some feedbacks, like start and stop...
|
||||||||||||||||||||||||||||
Modules |
You can restrict the trace to certain modules of the program.The choices are:
|
||||||||||||||||||||||||||||
Functions |
You can restrict the trace to certain functions within the desired modules of the program.The choices are:
|
||||||||||||||||||||||||||||
Trace Level |
You can also restrict the trace to certain "levels". The higher the trace level, the more detailed will be the trace. But higher level traces will generate huge trace files and will also slow down the program. User the higher levels when you start the trace close to the problem you have. For example if you have a problem when you click on the "Erosion" button of the Morpho mode, start sliceOmatic, load you image, go to the Morpho mode and start the trace just before you click on the "Erosion" button. Stop the trace immediately after your problem show up! On the other hand, if your problem is a crash of sliceOmatic, then you do not have to stop the trace, the crash did that for you.
|
||||||||||||||||||||||||||||
Start |
Start the trace for the selected modules and functions at the selected trace level. The trace will be called "sliceOmatic_trace.dat" and it will be placed in your "Scratch" directory (by default, Documents/TomoVision)
|
||||||||||||||||||||||||||||
Stop |
Stop the trace
|
||||||||||||||||||||||||||||
Exit |
Exit the interface |