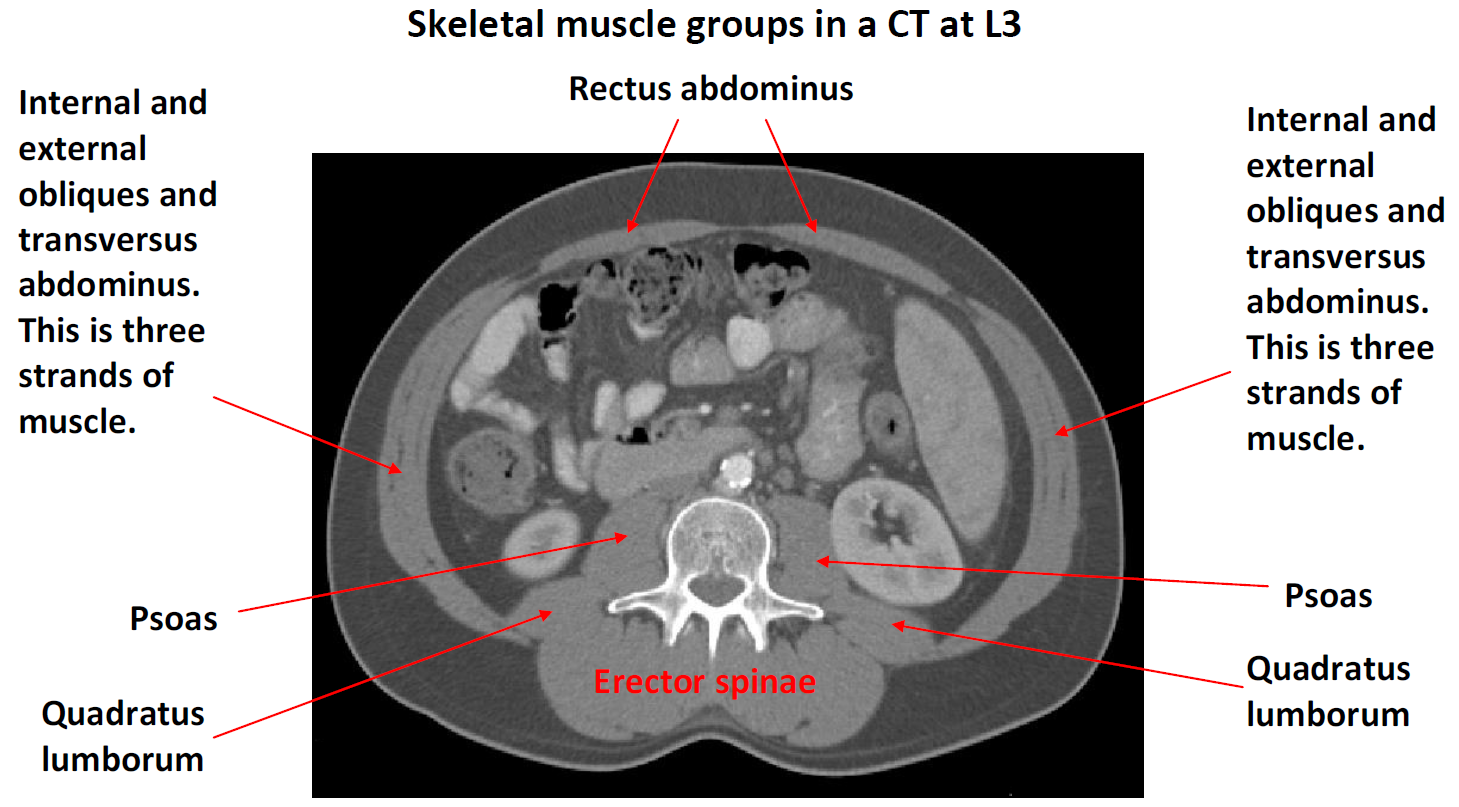
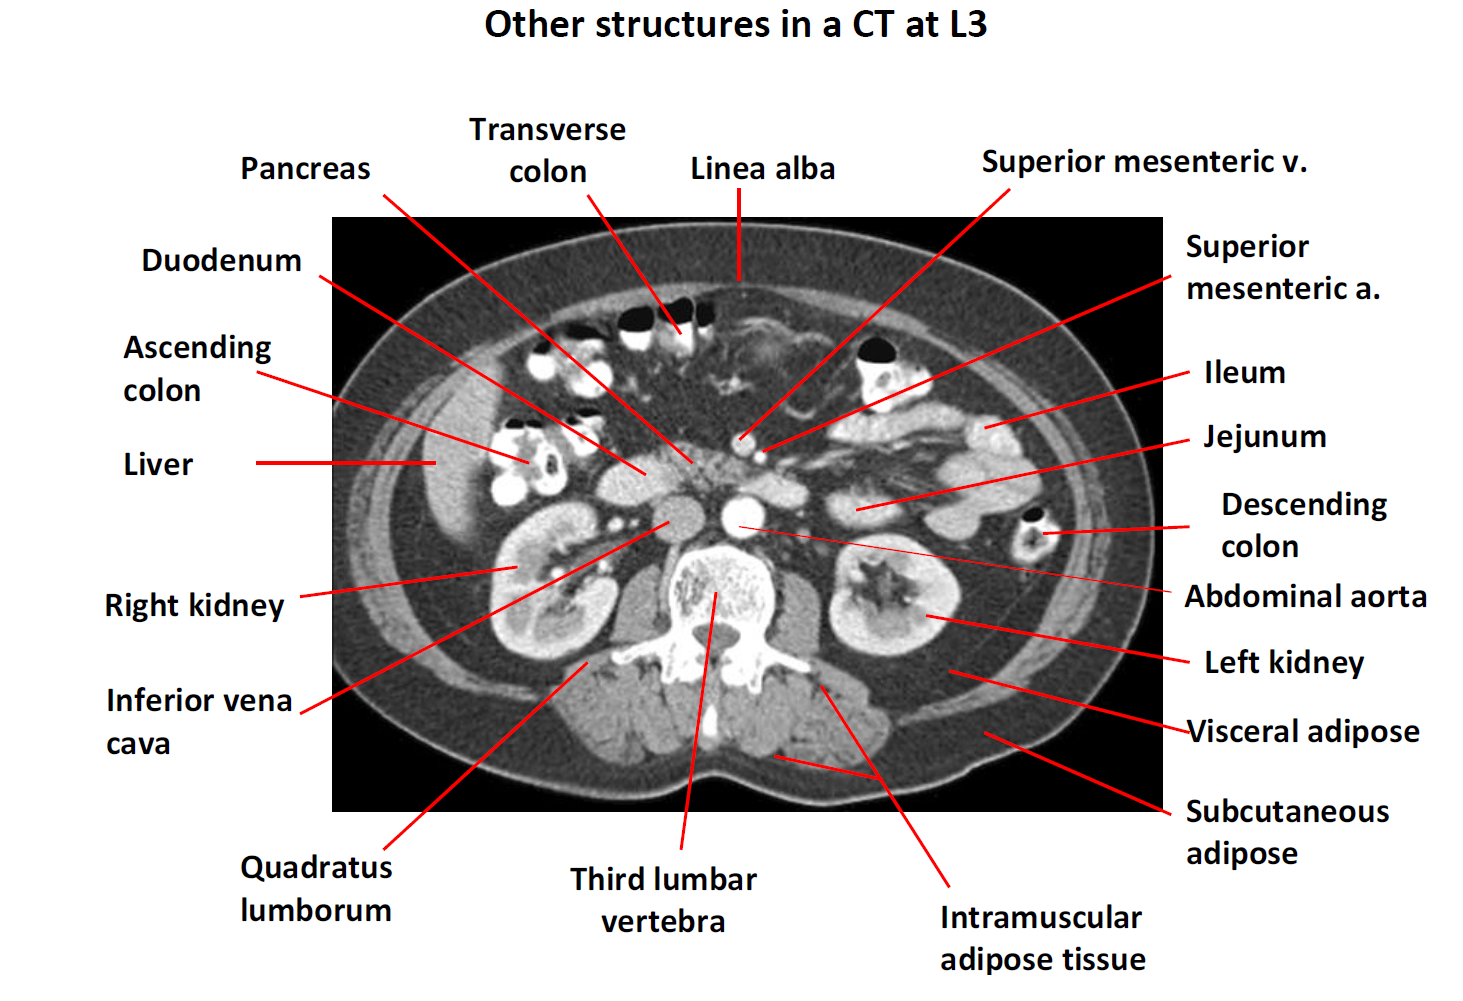
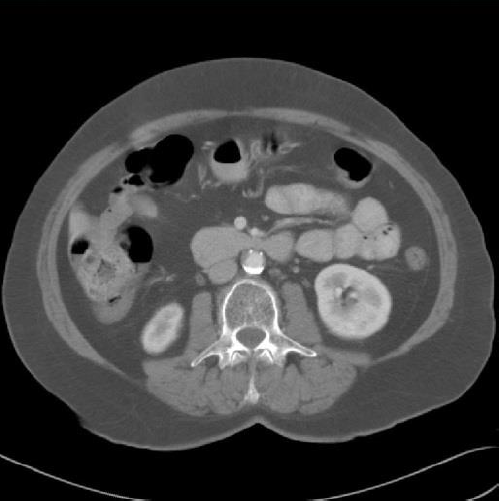
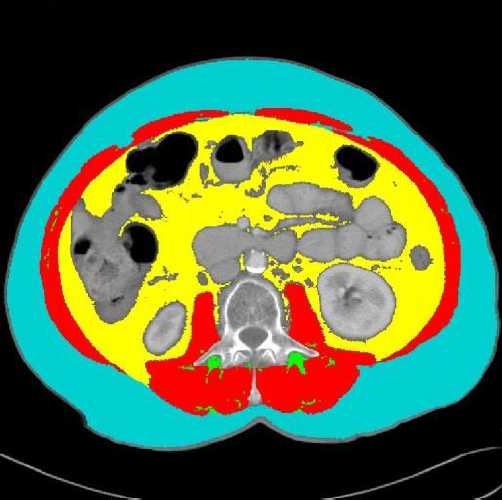
CT image analysis is the process of tagging (or coloring) the tissues of interest on the L3 CT image to determine tissue quantities.
The densities of different tissues will be used to quantify the different body composition components on the CT image.
·Tissue density is measured in Hounsfield Units (HU). As density increases, HU values increase.
oAir: -1000 HU
oWater: 0 HU
oSubcutaneous adipose tissue (SAT): -190 to -30 HU
oIntermuscular adipose tissue (IMAT): -190 to -30 HU
oVisceral adipose tissue (VAT): -150 to -50 HU
oSkeletal muscle: -29 and +150 HU
As muscle becomes more infiltrated with fat, its density (or HU value) will decrease as fat is less dense than muscle
oBone: > 400 HU
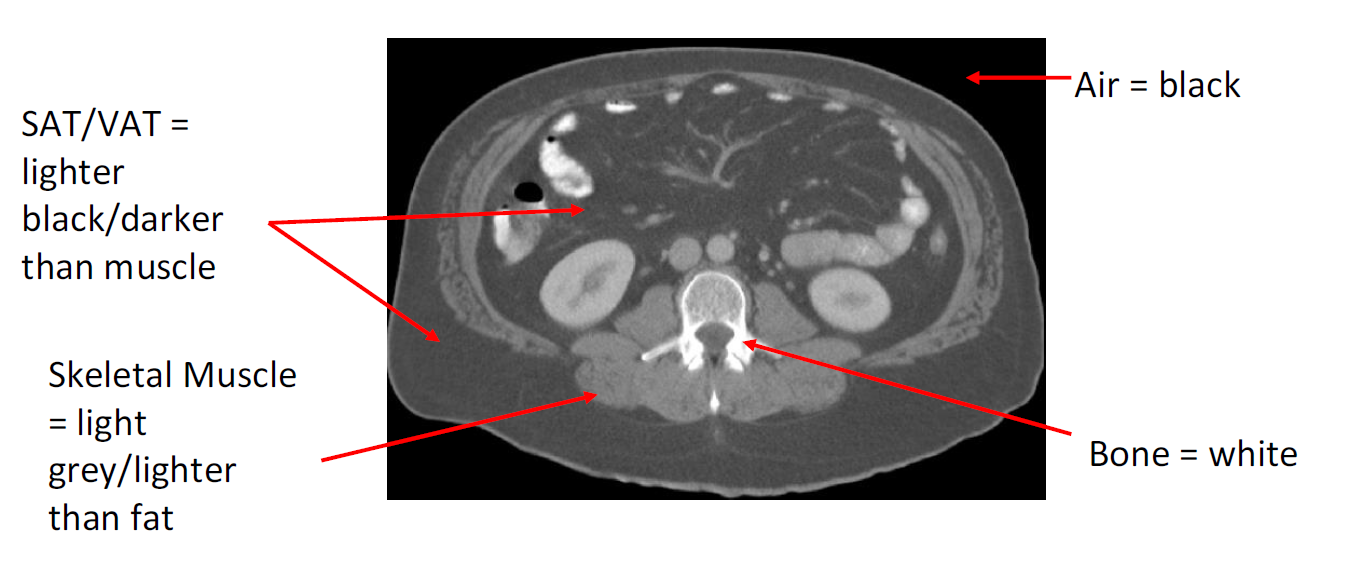
·On the CT image, less dense areas/tissues (e.g. fat, air) will appear darker or more black and more dense tissues (e.g., muscle, bone) will appear more grey or white
Less dense areas appear darker and more dense areas are grey or white
