Low Contrast Images can be analyzed
·Poor contrast scans are those which have little differentiation in the density between the different components
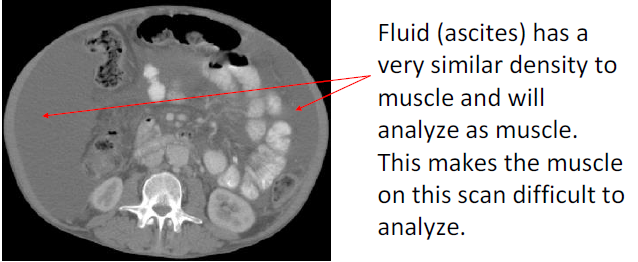
·If this scan is to be analyzed using normal muscle HU limits (-29 to +150), the muscle boundary will be difficult to determine and the image difficult to analyze
This is a difficult scan to analyze.
·The best strategy to deal with poor contrast scans is to determine the density of the muscle and the density of the surrounding tissue which is interfering with the analysis of muscle using the Pixel Info tool (Tools -> Pixel Info) and base the analysis around this information.
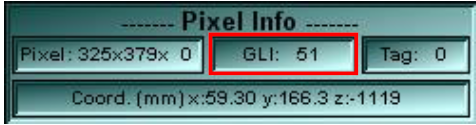
·With the Pixel Info tool open,
oPlace the cursor over the muscle and determine its GLI (or HU value). Move the cursor around the muscle and determine its rough GLI.
oAfter, place the cursor over the surrounding tissue which falls inside the - 29 to +150 range, but is not muscle to find out its rough GLI (or HU value).
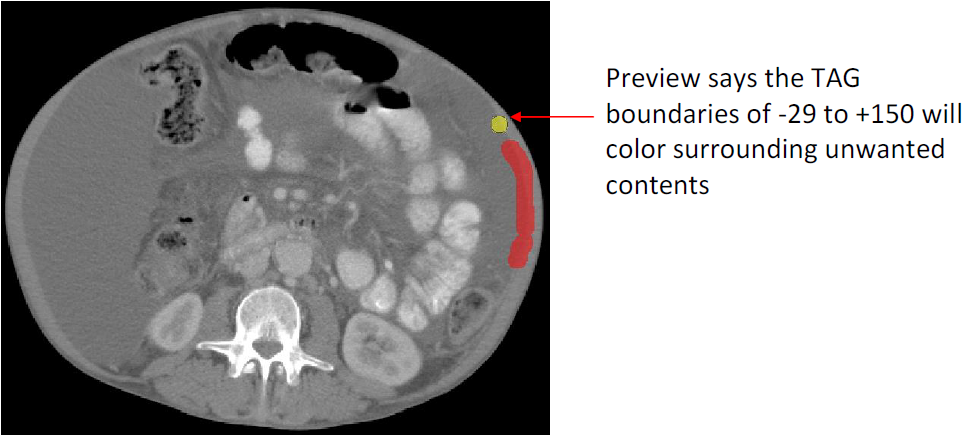
·With this information, the muscle TAG boundary will need to be temporarily adjusted so that it only analyzes tissue that is muscle and not unwanted surrounding contents
oIf the muscle GLI is lower than the surrounding interfering contents, the upper limit muscle boundary should be decreased
oIf the muscle GLI is higher than the surrounding interfering contents, lower limit muscle boundary should be increased
·To adjust the threshold, ensure that the Preview function is turned ON in the region growing tool.
·Choose the largest paintbrush. Place the cursor so that it straddles both the muscle and the surrounding contents that you wish to exclude.
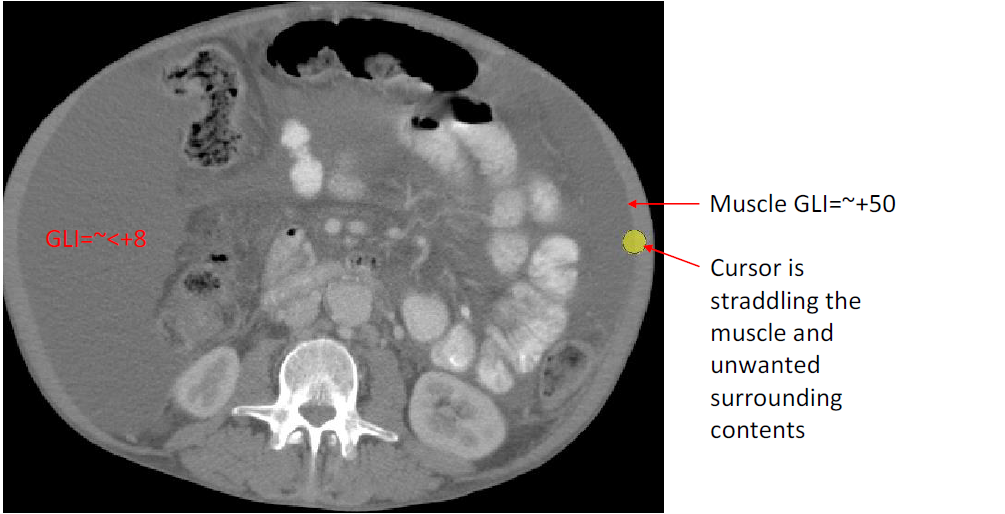
Using the Pixel info tool, the muscle on this scan has a GLI of ~50, the unwanted surrounding contents has a GLI of ~<8.
Because the muscle this sample scan has a higher GLI compared to the unwanted surrounding contents, the lower limit muscle boundary needs to be increased so that it no longer contains GLI values of the unwanted surrounding contents.
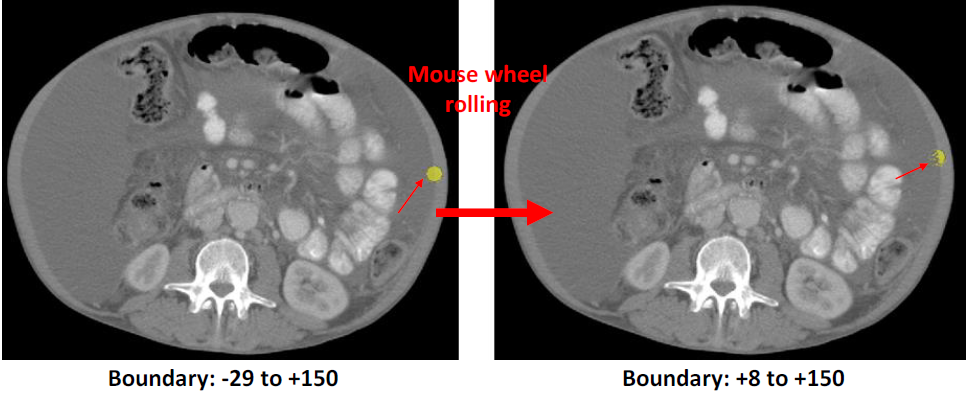
·In the region growing box, change the mouse wheel setting so that it now controls the lower limit (but if the unwanted tissue has a higher GLI than muscle, the upper limit should be chosen).
·While the cursor is straddling the muscle and unwanted tissue, gradually roll the mouse wheel so that the lower boundary becomes higher.
·As you are rolling the mouse wheel to increase the lower limit muscle boundary, watch the cursor preview (the yellow dot). There will gradually be less of the unwanted tissue being included for analysis as the lower limit boundary is increased.
·Keep rolling the mouse wheel until you are satisfied that you have found the proper boundary.
·Use this new boundary to outline the border between the muscle and the unwanted tissue. After the muscle surrounding the unwanted tissue has been analyzed, change the boundary back to -29 to +150 to fill in the inside of the muscle.
Note: For poor quality images that cannot be analyzed, the reason for no analysis must be documented. Low contrast images that can be analyzed must also have “low contrast” recorded in the database.