Plot_xxx_Highlight


Plot_OpenGL_HighLight

Plot_Window_HighLight


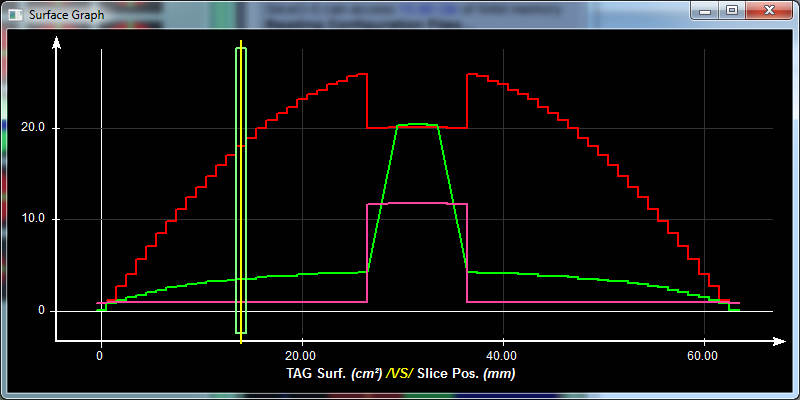
Draw a vertical line on the 2D plot to to either an OpenGL or a GDI window.


Syntax


void  Plot_OpenGL(

          Boxs *box,

          char dir,

          float val,

          float width,

                    float min, float max

) ;


void  Plot_Window(

          Boxs *box,

          char dir,

          float val,

          float width,

                    float min, float max

) ;


Parameters


box

Pointer to the a box that will contain the plot.


dir

Direction of the yellow line.

'x' = vertical line positioned on the "x" axis

'y' = horizontal line positioned on the "y" axis

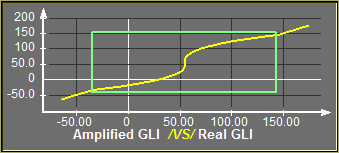
other = display a green box centred at val on both x and y axis


val

Position of the line.


width

Width of the green box surrounding the yellow line


min, max

The min (x and y) and max(x and y) parameters provided by the "Plot_OpenGL" or "Plot_Window" functions.


Return value


This function does not return a value.


Remarks


There are 2 variation for this function depending on whether you want to draw the plot to an OpenGL or a Windows GDI window.


Requirements


Header:

          TomoVision_Util.hpp

          plot.hpp


Library:

          TomoVision_Util.lib

          plot.lib


Example


#include          <windows.h>


#include          "sliceO_include.hpp"

#include          "plot.hpp"


extern           int          Gradient_Range ;

float          Gradient_Transform( float GLI_float, float target, float power, int width ) ;


// ----------------------------------------------------------------------------

int          Ctrl_Draw_Demo( Boxs *box, float offset, float power, int width )

{

//float          s ;

int          i, j ;


          Error_Fct( hwnd, FCT_IN_TRACE, "Tool Gradient: Ctrl_Draw_Demo()" ) ;


          box->Clear() ;


Plot_Datas  plot_data, *plot_vect[2] ;

Plot_List   plot_list ;


          // --- prepare the curves (20 points on each side of the inflection) ---

          plot_list.nb_point = 2 * (Gradient_Range+20) ;

          MALLOC( Plot_Point *, plot_list.point, plot_list.nb_point, sizeof(Plot_Point) ) ;


          for ( j=0, i=offset - (Gradient_Range+20); i < offset + (Gradient_Range+20); i++, j++ ) {

              plot_list.point[j].x = i ;

              plot_list.point[j].y = Gradient_Transform( i, offset, power, width ) ;

          }


          plot_data.val = &plot_list ;

          plot_data.color = 0x000FFFF ;

          plot_data.flag = PLOT_ON ;


          // --- Get the font size we will use for the annotations ---

          short Tools_Font_Scale =  (short)  Fct_Variable_Value( "$INTERFACE_TOOL_FONT_SCALE" ) ;


          plot_vect[0] = &plot_data ;

          plot_vect[1] = NULL ;


          // --- min & max values are provided by "Plot_Window"

          // and used in "Plot_Window_Highlight" ---

          Plot_Point min, max ;


          Plot_Window( box, plot_vect,

                              Tools_Font_Scale-1,

                              "Real GLI", "Amplified GLI",

                              "", "",

                              &min, &max ) ;


          // --- Green box showing the region of influence ---

          Plot_Window_HighLight( box, ' ',

                              offset,

                              2*width,

                              min.x, max.x ) ;


          return( 1 ) ;

}


See also