Plot_xxx


Plot_OpenGL

Plot_Window


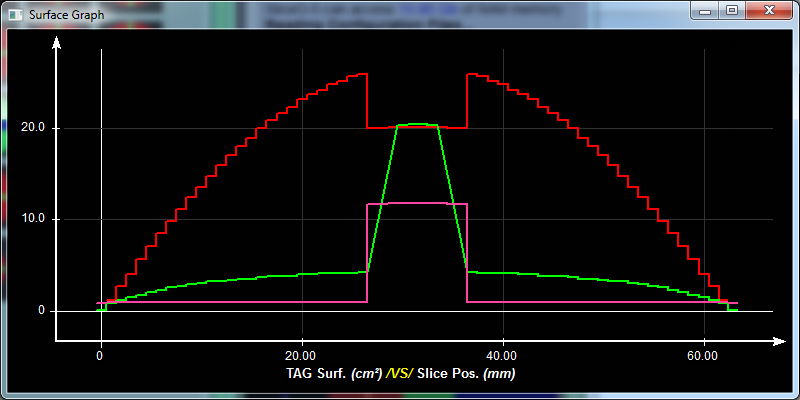
Draw a 2D plot to to either an OpenGL or a GDI window.


Syntax


void  Plot_OpenGL(

          Boxs *box,

          Plot_Datas **data,

          int size,

          char name_x[], char name_y[],

          char unit_x[], char unit_y[],

          Plot_Point *min, Plot_Point *max

) ;


void  Plot_Window(

                    Boxs *box,

          Plot_Datas **data,

          int size,

          char name_x[], char name_y[],

          char unit_x[], char unit_y[],

          Plot_Point *min, Plot_Point *max

) ;


Parameters


box

Pointer to the a box that will contain the plot.


data

A NULL terminated array of pointers to the plot data. Each Plot_Datas structure is for one curve, you can have multiple curves.


size

Font size to use for the plot annotation and legend.


name_x, name_y

names of the horizontal (x) and vertical (y) axis.  The legend displayed under the plot will be: "name_y (unit_y) /vs/ name_x (unit_x)"


unit_x, unit_y

names of the units used for the horizontal (x) and vertical (y) axis.  The legend displayed under the plot will be: "name_y (unit_y) /vs/ name_x (unit_x)"


min, max

Pointer to Plot_Point structures to receive the min (x and y) and max(x and y) values of all the data points used to display the plot.  These values are used by the "HighLight" functions.


Return value


This function does not return a value.


Remarks


There are 2 variation for this function depending on whether you want to draw the plot to an OpenGL or a Windows GDI window.

The plot functions will not erase the box's background, this should be done before the function is called.


Requirements


Header:

          TomoVision_Util.hpp

          plot.hpp


Library:

          TomoVision_Util.lib

          plot.lib


Example


#include          <windows.h>


#include          "sliceO_include.hpp"

#include          "plot.hpp"


extern           int          Gradient_Range ;

float          Gradient_Transform( float GLI_float, float target, float power, int width ) ;


// ----------------------------------------------------------------------------

int          Ctrl_Draw_Demo( Boxs *box, float offset, float power, int width )

{

//float          s ;

int          i, j ;


          Error_Fct( hwnd, FCT_IN_TRACE, "Tool Gradient: Ctrl_Draw_Demo()" ) ;


          box->Clear() ;


Plot_Datas  plot_data, *plot_vect[2] ;

Plot_List   plot_list ;


          // --- prepare the curves (20 points on each side of the inflection) ---

          plot_list.nb_point = 2 * (Gradient_Range+20) ;

          MALLOC( Plot_Point *, plot_list.point, plot_list.nb_point, sizeof(Plot_Point) ) ;


          for ( j=0, i=offset - (Gradient_Range+20); i < offset + (Gradient_Range+20); i++, j++ ) {

              plot_list.point[j].x = i ;

              plot_list.point[j].y = Gradient_Transform( i, offset, power, width ) ;

          }


          plot_data.val = &plot_list ;

          plot_data.color = 0x000FFFF ;

          plot_data.flag = PLOT_ON ;


          // --- Get the font size we will use for the annotations ---

          short Tools_Font_Scale =  (short)  Fct_Variable_Value( "$INTERFACE_TOOL_FONT_SCALE" ) ;


          plot_vect[0] = &plot_data ;

          plot_vect[1] = NULL ;


          // --- min & max values are provided by "Plot_Window"

          // and used in "Plot_Window_Highlight" ---

          Plot_Point min, max ;


          Plot_Window( box, plot_vect,

                              Tools_Font_Scale-1,

                              "Real GLI", "Amplified GLI",

                              "", "",

                              &min, &max ) ;


          // --- vertical line at the center of the graph with

          // a box showing the region of influence ---

          Plot_Window_HighLight( box, ' ',

                              offset,

                              2*width,

                              min.x, max.x ) ;


          return( 1 ) ;

}


See also