In this mode, you create segmented TAG images from the GLI Images (Grey Level Images).
The segmentation is done by a simple grey level thresholding on the GLI images with four different thresholds.
From the Graphic Interface
|
|
|
|
|
Display the histogram of the grey values of the GLI image(s). The vertical axis represents the number of pixels having a particular value, while the horizontal axis represents the possible values of the pixels (from Minimum at left to Maximum at right). The colors under the line correspond to the segmentation values fixed by the sliders. When the cursor is over an image, the GLI value of the pixel under the cursor can be seen as a vertical bar on the histogram. This tool is also described in the "Interface tools" section of the introduction
|
||
|
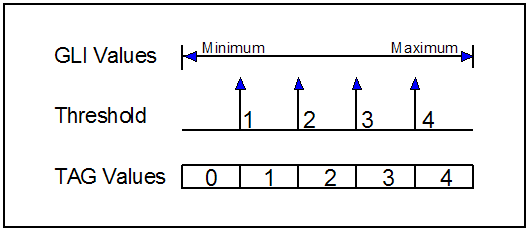
The 4 sliders are used to segment the GLI image by its values. The sliders range from the Minimum to the Maximum values of the GLI pixels. The sliders can be locked in position by pressing the “Scroll Lock” key while the cursor is over it.
•All GLI pixels with a value smaller than the first slider will have a Tag value of 0. •All GLI pixels with a value in between the first slider and the second slider will have a Tag value of 1. Idem for Tag values 2 and 3. •All GLI pixels with a value higher than the fourth slider will have a Tag value of 4.
Note:
|
||
|
You can use the mouse wheel to change the threshold values. You can select which of the threshold will be affected by the mouse wheel, or disable the mouse wheel control.
|
||
|
Toggle the preview mode. When on, the indicator on the button light up and the TAG displayed in the 2D windows will reflect the threshold selection.
|
||
|
Compute |
Pressing the Compute button will perform the real segmentation and create the TAG images. |

From the Display Area
The GLI value of the pixel under the cursor is highlighted in the interface’s histogram.
|
|
|
|
|
|
Mouse button |
Function |
|
|
|
|
|
|
Wheel |
Can increase/decrease the threshold values |
From the Keyboard
In addition to the keyboard shortcuts seen in section 5.2.0.3, the following keyboard keys , Specific to Thresholding, can also be used as a shortcut:
|
|
|
|
|
|
Key map |
Action (While the cursor is over one of the Threshold sliders) |
|
|
|
|
|
|
"Scroll Lock" |
Lock or Unlock the slider under the cursor. |
|
|
“Up Arrow" |
Decrease the TAG value associated with the slider under the cursor |
|
|
“Down Arrow” |
Decrease the TAG value associated with the slider under the cursor |
From the Command Line
System Variables defined in this module:
|
|
$THRESHOLD_MAX |
(U16,R) |
Maximum number of threshold sliders (= 4) |
|
|
$THRESHOLD_NB |
(U16) |
Actual number of threshold sliders. (Default = $THRESHOLD_MAX) |
|
|
$THRESHOLD_LIST |
(A,U16) |
List of the thresholds (1, ..., n) |
|
|
$THRESHOLD_GLI |
(A,F32) |
Array of threshold values for each threshold sliders. |
|
|
$THRESHOLD_TAG |
(A,U16) |
Array of associated TAG values for each threshold sliders. |
|
|
$THRESHOLD_WHEEL |
(U8) |
Mode of the mouse wheel (0=off, 1 to $THRESHOLD_NB ). |
Text commands recognized in this module:
Threshold: Threshold id value [tag]
Assign a value to the element "id" of the variables $THRESHOLD_GLI and $THRESHOLD_TAG if "tag" is present.
Threshold: Compute [val_1...]
Compute the segmentation for currently selected images. If threshold values are given, they will be used for the segmentation, otherwise, the values fixed by the interface are used.
Threshold: Slider t_id (lock|unlock|toggle)
Lock or unlock the sliders matching the template "t_id".
Threshold: Wheel (off|1|2...)
Assign a value to the variable $THRESHOLD_WHEEL_MODE that define the action of the mouse wheel.